"
R/test.R
test-figures.Rd
Other tests: index, test-crayon, test-dont, test-links, test-lists, test-long-lines, test-math-examples, test-output-styles, test-params, test-sexpr-title, test-tables, test-verbatim
index
test-crayon
test-dont
test-links
test-lists
test-long-lines
test-math-examples
test-output-styles
test-params
test-sexpr-title
test-tables
test-verbatim
x <- seq(0, 2 * pi, length.out = 25)
plot(x, sin(x))


plot(1:10)
lines(1:10)
text(2, 5, "Hello", srt = 30, cex = 2)


plot(1:3, col = c("red", "green", "blue"), pch = 16, cex = 10)
 plot(1:10)
lines(1:10)
text(2, 5, "Hello", srt = 30, cex = 2)
plot(1:10)
lines(1:10)
text(2, 5, "Hello", srt = 30, cex = 2)
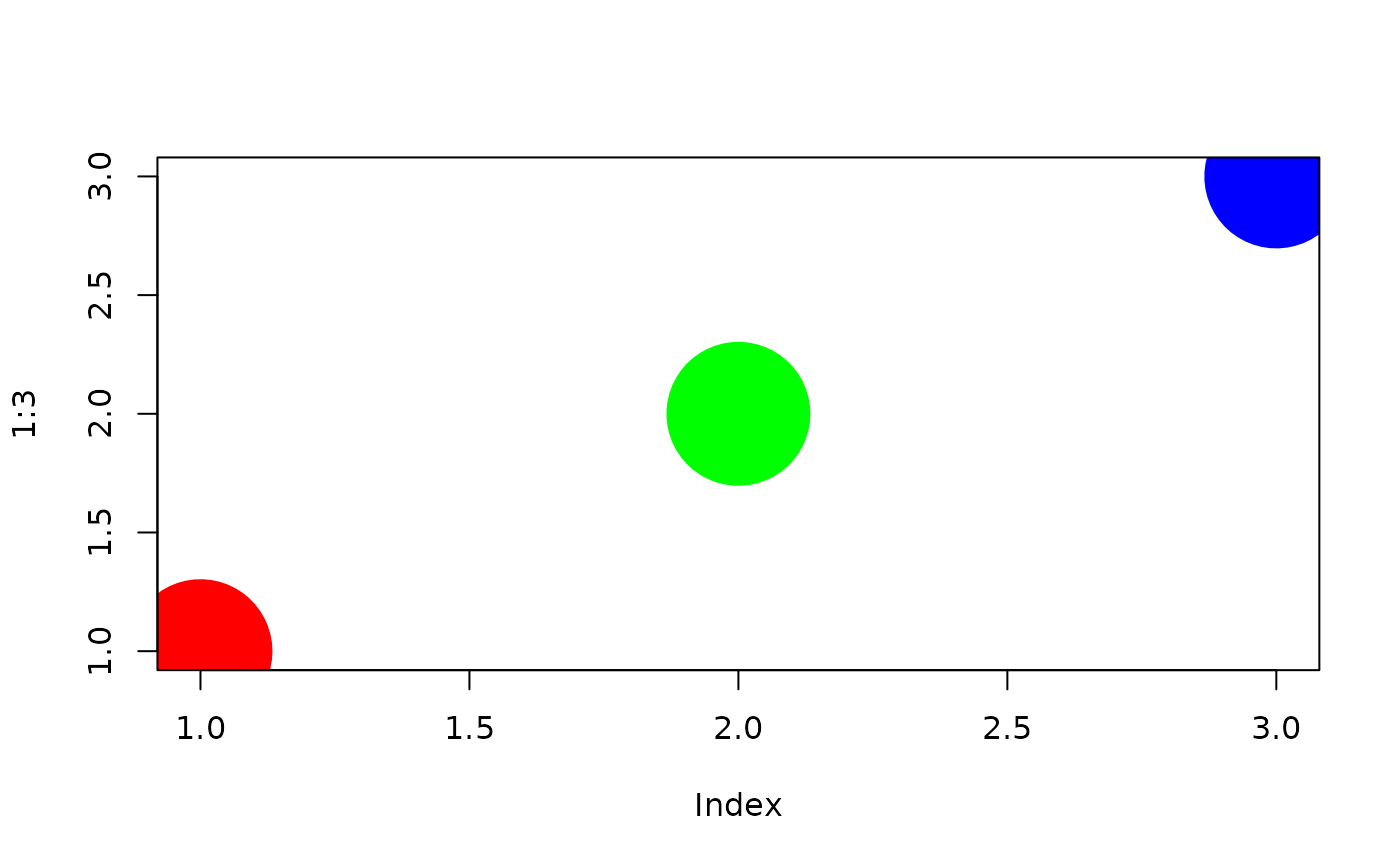
 plot(1:3, col = c("red", "green", "blue"), pch = 16, cex = 10)